
Nifty 50 technical analysis 2025: Key Levels, Signals and What’s Next
Published: Jul 15, 2026
Key Points
- The Nifty 50 in 2025 is not a guessing game - it is a levels game.
- The 21,900 base and the 24,800 ceiling define the current range.
- Whoever breaks that range with conviction and volume will set the tone for the second half of the year.
- Watch the weekly close, watch the RSI, and above all watch what institutional money does at those edges.
- That is where the real signal lives.
The chart does not lie. It simply waits for you to stop arguing with it.
That line, worn thin by repetition in trading rooms across Dalal Street, has never felt more relevant than it does heading into mid-2025. The Nifty 50 has been a battlefield — not the dramatic kind that makes front pages every morning, but the slow, grinding kind that quietly separates the disciplined from the desperate.
After the turbulence of late 2024, when foreign institutional investors pulled capital with a consistency that rattled even seasoned fund managers, the index found its footing somewhere near the 21,900 band and spent the better part of the first quarter of 2025 clawing its way back. Where it goes from here is the question every analyst, every trader, and frankly every retail investor with a demat account is trying to answer.
What follows is not a prediction. Nifty 50 technical analysis 2025 is, at its most honest, a reading of probability — a structured way of asking what the market has done under similar conditions before and what it tends to do next. The key word there is “tends.” Nothing is guaranteed on a chart. But the signals being picked up right now are worth taking seriously.
The Structure of the Rally: Reading the Rebound
For much of October and November 2024, the Nifty 50 was in freefall — at least relative to its own recent history. The index shed nearly 11% from its September high of around 26,277, reaching a low close to 21,964 in the third week of November. At that level, something interesting happened. Selling pressure didn’t accelerate. It slowed. And in technical analysis, that matters as much as the direction itself.
That November low has since become the anchor for how most technical analysts are framing the current structure. It was not a random bounce. The 21,900–22,000 band aligned with multiple data points: a long-term rising trendline drawn from the COVID lows of 2020, a 61.8% Fibonacci retracement of the 2023–2024 bull run, and a zone where buying consistently absorbed selling pressure across prior corrections in 2022 and 2023. Three confluences at one price zone. That is not coincidence — that is structure.
By February 2025, the Nifty had reclaimed the 23,000 mark, and the 50-day and 200-day moving averages — the two metrics no institutional desk ignores — had begun flattening and, in the 50-day’s case, curling upward. A golden cross, where the 50-day crosses above the 200-day, had not yet formed at the time of writing, but the conditions were setting up. That setup alone drew renewed attention from momentum-driven funds that had been sitting on the sidelines.
Chart Pattern, Support, Resistance: The Levels That Actually Matter
Ask five technical analysts what the most important level on the Nifty 50 chart is right now and you will likely get five different numbers — but they will cluster around a handful of zones. That clustering is itself useful information. The chart pattern support resistance Nifty framework currently being watched most closely centres on three areas.
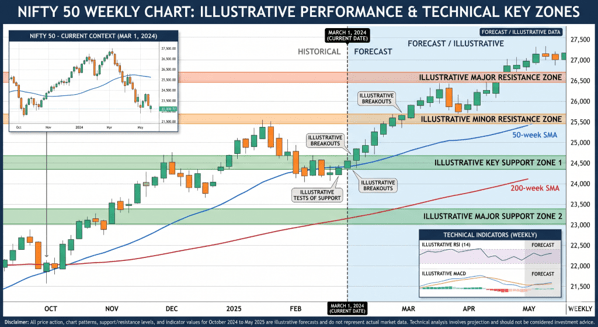
On the downside, 22,800–23,000 is the first meaningful support band. This is where the 200-day moving average is sitting as of Q2 2025, and it is also the approximate neckline of what appears to be an inverse head-and-shoulders pattern forming on the weekly chart. A close below this zone on a weekly basis would change the short-term narrative significantly.
The second support zone — the one that really matters — is 21,900. A break below that level would erase the entire base-building process that has taken place since November and would force a fundamental re-evaluation of the medium-term outlook. Most institutional analysts have contingency frameworks ready for that scenario, though very few are actively positioning for it.
On the upside, the resistances are equally well-defined. The 24,400–24,800 zone saw significant distribution in January 2025 — meaning sellers were active there at scale. That overhead supply needs to be absorbed before the index can make a credible run at the 25,500 mark, which is the next logical target based on the measured move from the inverse head-and-shoulders pattern. Beyond that, the old all-time high of 26,277 stands as the ultimate test for the bulls.
Three Real-World Signals: What Happened, What It Meant
Technical analysis lives or dies on its track record in real conditions. Here are three concrete episodes from the last twelve months on the Nifty 50 that illustrate how the levels and signals played out.
The first was the pre-election surge in April 2024. As the general election approached, the Nifty pushed decisively through the 22,500 resistance that had capped it for months, doing so on above-average volume. That breakout was textbook — a clean move through a known resistance with confirming volume, followed by a brief retest of 22,500 as support before the index climbed to its eventual peak near 26,277 in September. Traders who used the 22,500 breakout as an entry signal with stops below the prior resistance had one of the cleaner setups of the year.
The second episode was the post-election correction in June 2024. The BJP’s reduced majority spooked markets and the Nifty fell sharply in a single session — one of the largest single-day point drops in years. Importantly, the index did not breach its long-term rising trendline on a closing basis. It tested it, held it, and recovered. Analysts who had pre-identified that trendline as a structural floor were far less rattled than those operating without a framework.
The third example is more recent: the RSI divergence that formed on the weekly chart between August and September 2024. As the Nifty made a new all-time high near 26,277, the Relative Strength Index failed to confirm with a new high of its own. That kind of negative divergence between price and momentum is a well-documented warning signal.
It does not call the exact top, but it flags exhaustion — and the 11% correction that followed was broadly consistent with what that signal historically implies.
What Analysts Are Watching Now: The Signals Heading Into Q3 2025
The consensus among technically-oriented analysts is cautiously constructive, with a few non-negotiable conditions. The weekly RSI is currently recovering from oversold territory but has not yet crossed the 60-level threshold that most momentum systems treat as a confirmation of trend resumption. Volume on up-days has been incrementally stronger than on down-days in recent weeks — a small but meaningful shift in the demand-supply balance.
The options market adds another layer. The Put-Call Ratio (PCR) for Nifty options has been running at levels that have historically preceded positive price action, suggesting that the market is positioned more defensively than the recent price recovery would imply. When the market’s actual positioning is more fearful than its price suggests, rallies can be sharper than expected because the squeeze of short positions adds fuel to any genuine move higher.
The sector rotation signals are also worth noting. In prior bull phases, Financial Services and IT have tended to lead the Nifty higher. In recent weeks, Banking sector index (Bank Nifty) has shown relative strength, recovering faster than the broader index after the November lows. That is the kind of internal market behaviour that tends to precede, not follow, Nifty recoveries.
Conclusion: The Market Rewards Preparation, Not Prediction
Technical analysis is, in the end, a discipline of structured preparation. It does not hand you certainty — nothing in markets does. What it does is give you a map: here is where support is likely to hold, here is where resistance is likely to be tested, here is the signal that would tell you the map is wrong and force a re-route.
The Nifty 50 in mid-2025 is at one of those genuinely interesting junctures — not because the outcome is obvious, but because the levels are clear. The 21,900 floor has held and matters. The 24,400–24,800 supply zone is the immediate hurdle. A move through it on strong volume, accompanied by RSI confirmation, would put 25,500 on the table. A failure to clear it — particularly if accompanied by weakening breadth and rising institutional selling — would shift the probabilities back toward the bears.
For founders and early-stage investors watching markets as part of their capital allocation thinking: the lesson here is not about short-term trading. It is about using frameworks to make decisions under uncertainty. The chart will not tell you what will happen. But it will tell you what conditions would change your view, which is often the more valuable piece of information anyway.
Frequently Asked Questions
1: Where can I find a reliable Nifty 50 technical analysis 2025 report?
You can find a professional Nifty 50 technical analysis 2025 breakdown directly inside this comprehensive market update, which evaluates historical price actions, volumes, and major structural shifts.
2: How should a retail trader interpret a chart pattern support resistance Nifty layout?
A retail trader should use the chart pattern support resistance Nifty layout to map out major accumulation floors, tracking institutional supply blocks to manage risk effectively.
3: What makes the 21,900 level vital in this Nifty 50 technical analysis 2025?
In this current Nifty 50 technical analysis 2025, the 21,900 zone acts as the ultimate line in the sand, matching multi-year trendlines and key Fibonacci retracement markers.
4: Where does the main chart pattern support resistance Nifty configuration place the ceiling?
The primary chart pattern support resistance Nifty configuration places the immediate overhead ceiling at the 24,400–24,800 supply cluster, where massive distribution occurred earlier this year.
5: Are momentum indicators showing a reversal in the Nifty 50 technical analysis 2025?
The latest Nifty 50 technical analysis 2025 shows the weekly RSI climbing out of oversold zones, though it requires a firm break past 60 to confirm long-term trend resumption.
6: Does an inverse head-and-shoulders fit into the chart pattern support resistance Nifty framework?
Yes, a developing inverse head-and-shoulders matches the chart pattern support resistance Nifty framework perfectly, projecting a future target of 25,500 if the neckline breaks.
7: How did past RSI divergences validate this Nifty 50 technical analysis 2025 approach?
Past metrics validate this Nifty 50 technical analysis 2025 strategy because the weekly RSI divergence in late 2024 successfully flagged momentum exhaustion right before an 11% market drop.
8: What immediate trading adjustments does the chart pattern support resistance Nifty map suggest?
The chart pattern support resistance Nifty map suggests maintaining tight stop-losses just below the 22,800–23,000 zone, which lines up with the critical 200-day moving average.
9: Why is derivatives data integrated into this Nifty 50 technical analysis 2025?
Derivatives details are added to the Nifty 50 technical analysis 2025 because a defensive Put-Call Ratio (PCR) reveals market fear, which often triggers swift short-covering rallies.
10: Can sector rotation alter the broader chart pattern support resistance Nifty target levels?
Sector rotation heavily impacts the chart pattern support resistance Nifty target levels; for instance, the recent outperformance of the Bank Nifty index provides the core engine needed to clear overhead resistance.
Citations & References
[1] National Stock Exchange of India (NSE). Nifty 50 Historical Data. nseindia.com. Accessed May 2025. [Online].
Available:
https://www.nseindia.com/
[2] Pandya, A. & Mehta, R. (2024). Fibonacci Retracement and Trend Analysis in Indian Equity Markets. Indian Journal of Finance, 18(3), 44–58.
[3] Investopedia. Relative Strength Index (RSI). investopedia.com. Accessed April 2025. [Online].
Available:
https://www.investopedia.com/terms/r/rsi.asp
[4] Zerodha Varsity. Technical Analysis Module — Support, Resistance, and Chart Patterns. zerodha.com/varsity. Accessed April 2025. [Online].
Available:
https://zerodha.com/varsity/module/technical-analysis/
[5] Motilal Oswal Research. India Equity Market Outlook Q1 2025. motilaloswal.com. Accessed March 2025. [Online].
Available:
https://www.motilaloswal.com/
[6] CMT Association. Technical Analysis Body of Knowledge (TABOK). cmtassociation.org. 2023. [Online].
Available:
https://cmtassociation.org/
[7] EvePlacement. [Online].
Available:
https://eveplacement.com/
Streamline Your Hiring with Eve Placement
Engage, assess, and recruit top talent through tailored AI hiring challenges that go beyond resumes. Ready to hire better? Contact our research team for a custom consultation.